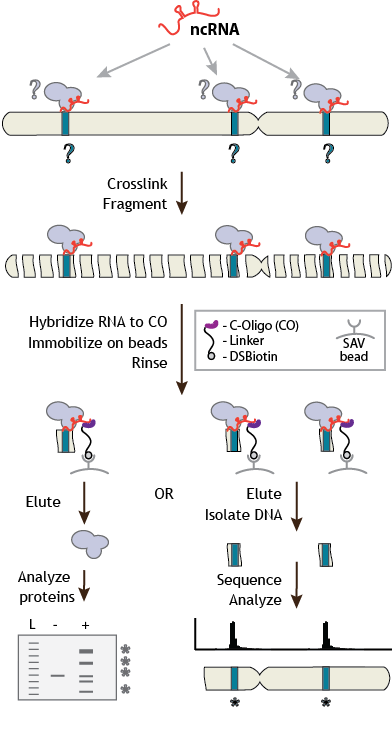
We know much more about the protein and DNA content of chromatin than the RNA content. CHART was developed to answer the question of where lncRNAs localize in the genome, similar to ChIP experiments for proteins. CHART was developed while Matt was working as a Helen Hay Whitney Fellow in Bob Kingston’s lab.
For more information see:
Simon, M. D., Wang, C. I., Kharchenko, P. V., West, J. A., Chapman, B. A., Alekseyenko, A. A., Borowsky, M. L., Kuroda, M. I., and Kingston, R. E. (2011) The genomic binding sites of a noncoding RNA, Proc Natl Acad Sci U S A 108, 20497-20502. PMID:22143764. (Pubmed)
Simon, M. D. (2013) Capture Hybridization Analysis of RNA Targets (CHART), Curr Protoc Mol Biol Chapter 21, Unit 21 21.25. PMID:23288463. (Pubmed)
